Texts From Your Club's Own Name — Plus One-Member Messages and a Searchable Archive
3 July 2026
Fleet utilisation is the most useful number a boat club committee can watch, yet few clubs measure it. How to count it honestly, what distorts it, and how to act on the pattern.
Ask a committee how the fleet is performing and you will get impressions. The RIBs are always out. Nobody touches the old day boat. Somebody is fairly sure Saturdays have gone quiet. Impressions are a poor basis for spending decisions, and fleet utilisation is the number that replaces them. Hardly any club measures it.
That is partly because it sounds like haulage jargon, and partly because for most of a club's history the data lived in a paper diary. But if your bookings are recorded anywhere at all, you can work it out in an evening. Here is what to count, what will mislead you, and what to do with the pattern once you can see it.
Utilisation is booked slots divided by bookable slots. Both halves need defining honestly.
A bookable slot is one a member could actually have reserved. If your club runs a morning and an afternoon slot, each boat offers two slots a day, minus any days it was out of service, blocked for maintenance or ashore for the winter. Counting those dead days as available flatters nothing and buries your downtime, which is a figure worth knowing in its own right.
A booked slot is one that was reserved, whether or not anyone turned up. A no-show occupied the slot and denied it to someone else, so it counts as booked. Track no-shows separately; a boat with high utilisation and a high no-show rate has a different problem from a boat nobody wants.
A worked example: a ten-boat club in a thirty-day month offers 600 slots if everything stays in service. If members made 180 bookings, that is 30 per cent. Whether 30 per cent is good depends entirely on the month and the fleet, which brings us to the two things that distort the figure.
The first distortion is the average itself. A fleet running at 40 per cent might be five boats each at 40, or one boat at 85 and four boats near 20 — the headline looks identical, and the situations could not be more different.
The hero boat is wearing out at twice the rate you budgeted for, and every member who wanted it and missed it logged a small frustration. The quiet tail, meanwhile, is capital sitting on a mooring accruing insurance, antifoul and depreciation. Always look at the per-boat spread. The gap between your busiest and quietest boat usually says more than the mean does.
The second distortion is the calendar. Comparing February with July tells you only that winter exists. The honest comparison is this February against last February, and ideally the February before that.
Even then, weather muddies it. A fortnight of gales can sink a month's figures, and no committee decision should rest on one bad month. Watch the trend across seasons instead. When you do compare within a year, compare the shape rather than the level: which boats, which days, which halves of the day. The shape stays surprisingly stable even when the raw numbers swing about.
Once you can see a skewed fleet, there are broadly three responses, and they are worth trying in this order.
Split the figures one more way before you act: morning against afternoon. If mornings run at 70 per cent and afternoons at 25, buying another boat solves the wrong problem, because the constraint is timing, not hulls. Members may be chasing the tide, or getting out before the afternoon breeze fills in. That pattern argues for looking hard at what the afternoon slot offers, not at the brochure for a new RIB.
Utilisation earns its keep at exactly these moments. A purchase proposal should cite the utilisation of the boats it would duplicate. A disposal should rest on two seasons of per-boat figures, not on one member's fondness for a hull. A fee debate is better informed by whether members can actually get a slot when they want one.
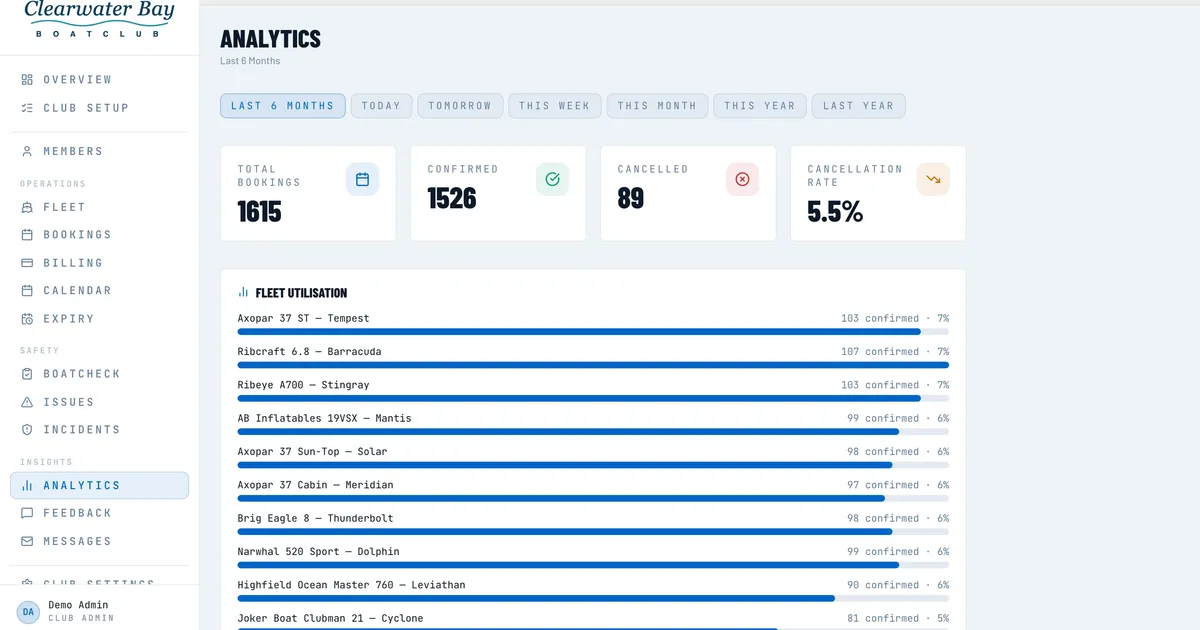
None of this needs to be laborious. If your bookings already sit in software such as Nauticore, per-boat utilisation and the morning-afternoon split are on the analytics screen already; if they sit in a diary, an hour with a spreadsheet each quarter will do. The value is not in the precision of the number. It is in the habit of watching it, boat by boat, season against season, so the next fleet decision starts from evidence rather than from the loudest voice at the table.
See it in action
All Nauticore features are live in the interactive demo — no signup required.